Pricing and subscription strategies for 2025
31 Jul 2025

The in-app purchase market is booming and is expected to reach $170 billion by 2025. With the advent of AI, creating and launching apps is faster than ever. However, turning these apps into sustainable revenue streams has become more difficult. According to Adapty's latest report, based on an analysis of $1.9 billion in revenue from over 11,000 apps, we offer valuable insights to separate the winners from the rest.
Subscription Market Analysis
Revenue Distribution by Region
United States: The United States remains the largest market for integrated subscription sales, accounting for 48.9% of total revenue.
Europe: Europe ranks second with 24.8% of revenue, providing a solid foundation for pricing strategies in mature markets.
APAC: The Asia-Pacific region is gaining ground, contributing 10.3% of global subscription revenue.
Subscription duration
Weekly subscriptions: Weekly plans have grown by nearly 10% since 2024, capturing nearly half of all subscriptions. Users seem to prefer the flexibility of short-term plans.
One-time purchases: One-time purchases are up 6%, providing an additional revenue stream beyond subscriptions.
Annual, monthly and lifetime subscriptions: All of these subscription types have declined as users move away from long-term commitments.
Application categories
Weekly subscriptions: Weekly plans dominate in categories such as productivity, utilities, and photo & video, accounting for more than 50% of revenue in each of these categories.
Annual subscriptions: Annual plans lead in health & fitness (57%) and education (28%), where users are more likely to commit to long-term results.
Lifestyle apps: Lifestyle apps favour diverse pricing models: ‘other’ plans lead (42%), with weekly and monthly plans tied at 22% each.
Subscription price analysis
Weekly subscription prices
Europe: Europe has the highest weekly price at £6.30, up 12.2% from last year, the largest increase among the regions.
United States: The United States follows with £6.50 after a 12.5% increase.
APAC and LATAM: These regions showed more modest growth, both adding around 7% compared to 2024.
MEA: MEA reached £5.10, increasing 7.6% year-on-year.
Monthly subscription prices
Europe: Europe saw the largest year-over-year increase (+9.9%), with the average price reaching £10.5 in 2025.
United States: The United States followed with +2% growth, pushing the average to £12.5.
LATAM and APAC: These regions slipped slightly, with modest price declines compared to 2024.
Annual subscription prices
United States and Europe: These regions saw moderate increases, reaching $44.6 and $42, respectively.
LATAM, APAC, and MEA: These regions saw modest declines, suggesting price stabilisation in these markets.
Adapty Pricing Index
The Adapty Pricing Index compares median subscription prices across countries, using the United States as a reference (1.00). For example, in the Netherlands, a subscription costs 62% more than in the United States, while in Turkey, it costs nearly 3.5 times less.
Lifetime Value (LTV) and Profitability
LTV by Category
Productivity and Utilities: These categories see the highest LTV on weekly plans, the best results among all categories.
Health & Fitness, Photo & Video, and Education: Annual plans perform best in these categories, where users remain engaged for longer periods of time.
Lifestyle apps: Monthly plans perform best for lifestyle apps.
LTV by region
United States: All plans converge around $47-49 in LTV, with annual plans slightly ahead.
Europe: Annual plans lead with an LTV of $44.
LATAM: Weekly plans outperform monthly and annual plans.
APAC: Annual subscriptions offer the highest LTV over 12 months in the region.
MEA: Weekly and annual plans achieve the same LTV, but in different ways.
Conversion benchmarks
Free trials
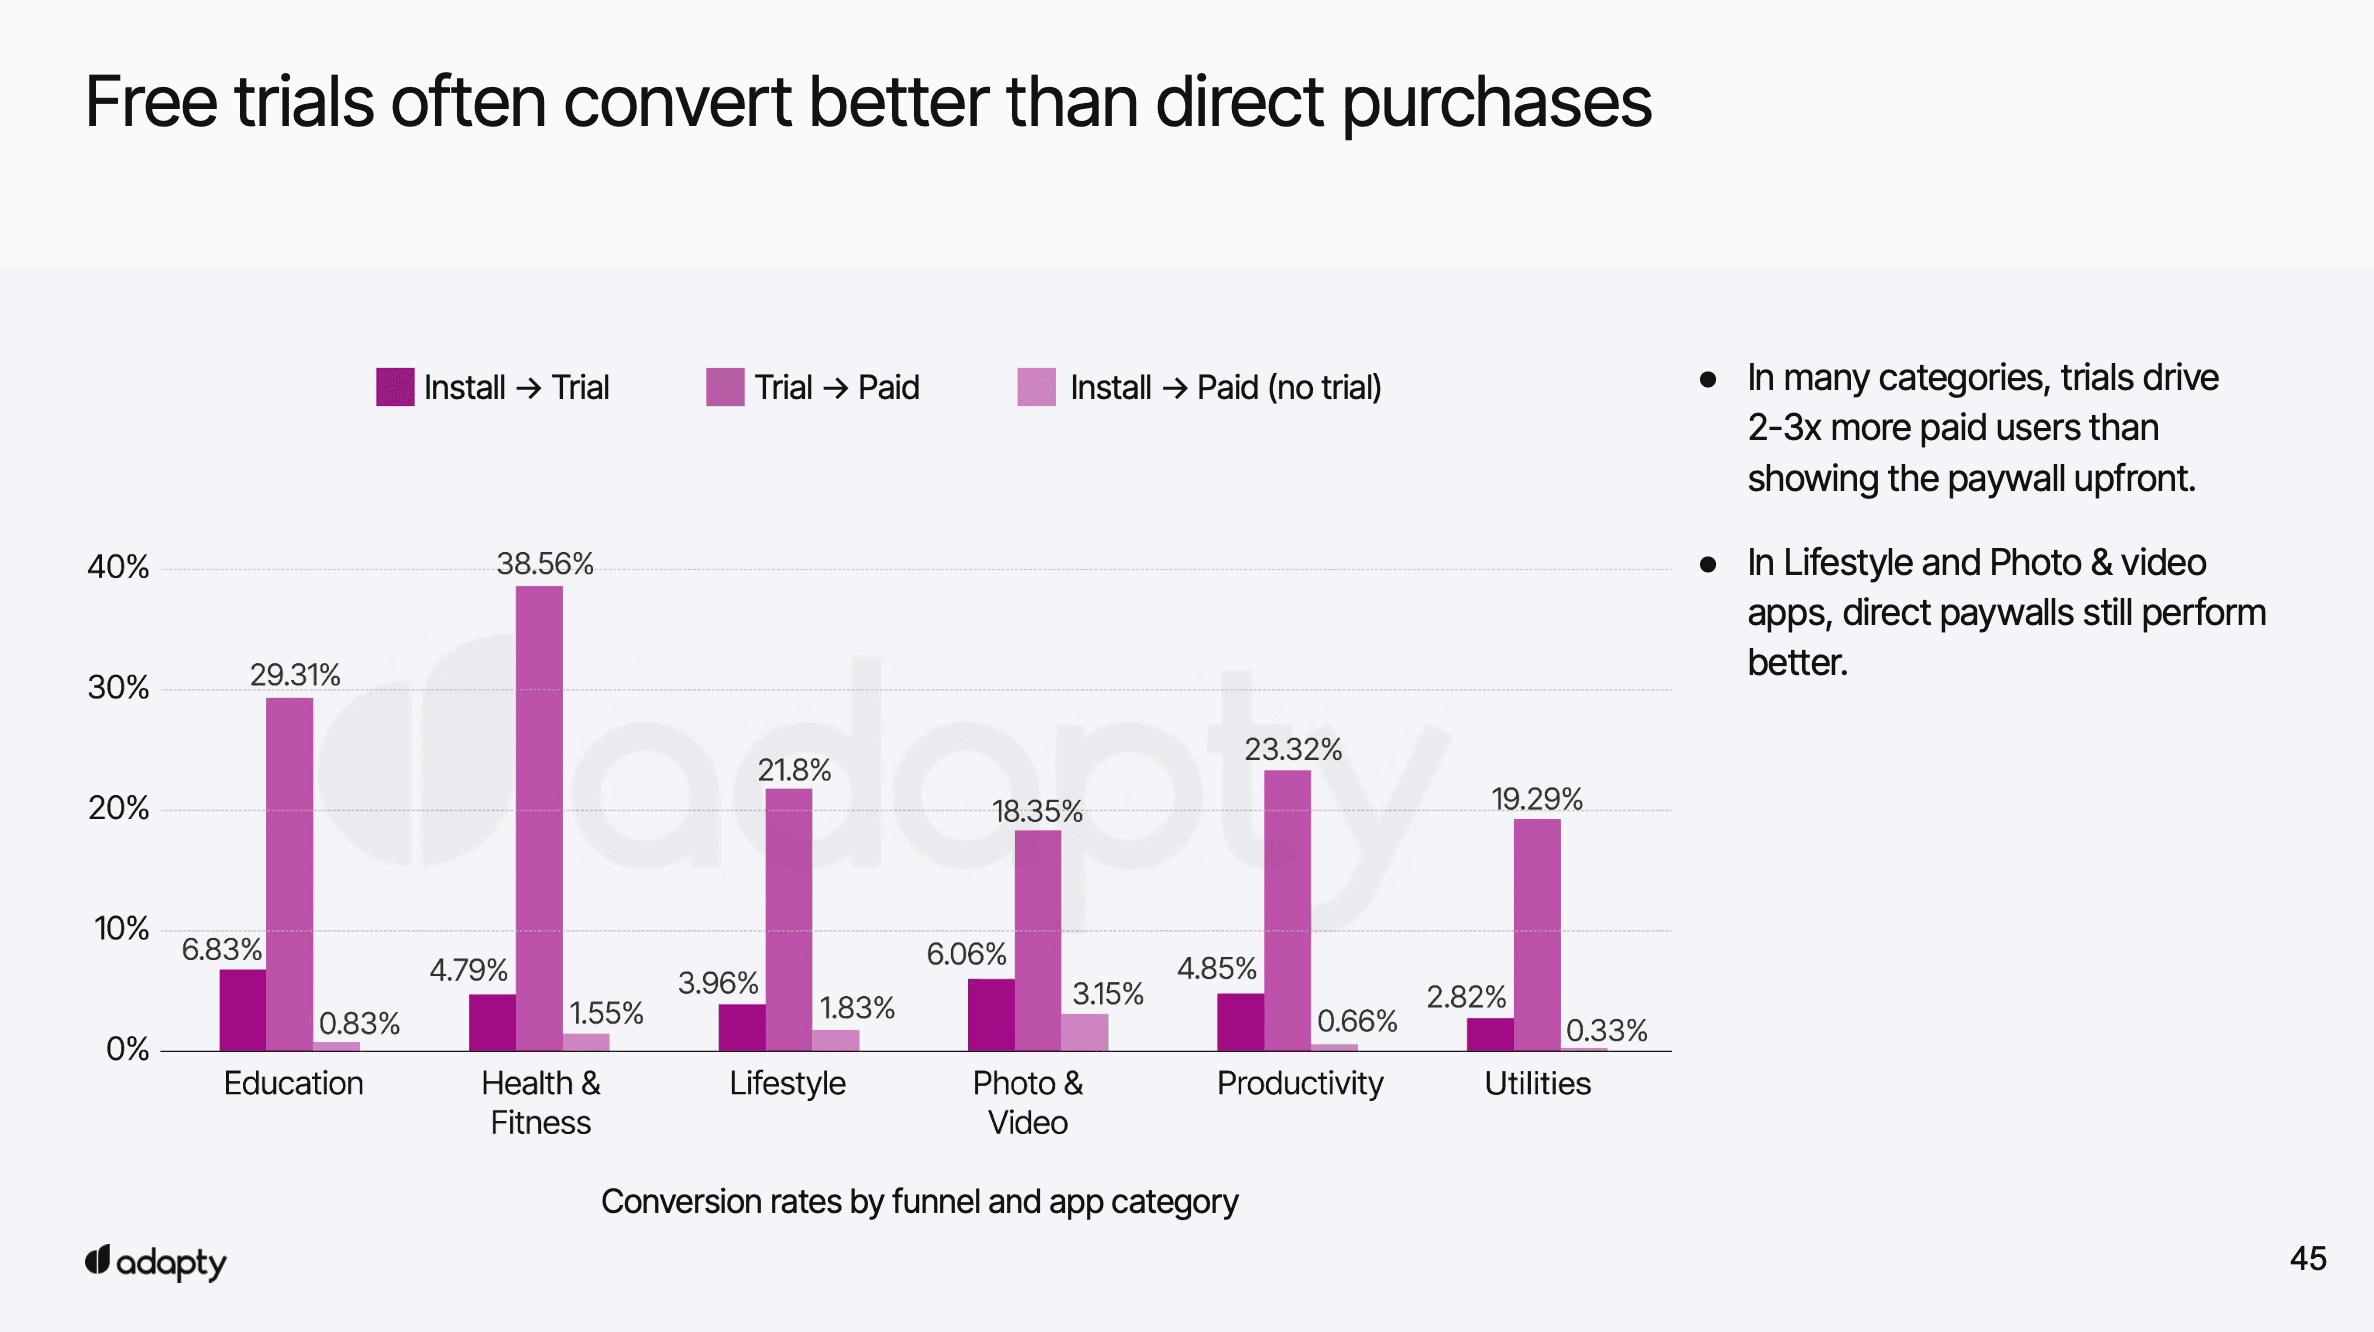
In many categories, free trials generate 2 to 3 times more paying users than direct paywall display.
In lifestyle and photo & video apps, direct paywalls perform better.
Retention
Retention improves after conversion, but early churn still hinders growth.
Free trials improve retention, especially in short-term plans.
Lower prices do not always mean better retention.
Refund trends
Refund rate
Annual plans show the highest refund rate (4.2%), suggesting unmet expectations or changing user needs.
Lifetime and monthly plans fall in the middle (~3%), while weekly plans have the lowest refund rate (2.6%), suggesting that users feel more secure with short-term options.
Refunds by region
LATAM and United States: These regions have the highest refund rates, at 3.45% and 3.08% respectively.
Europe and MEA: These regions have the lowest refund rates, both around 2.3%.
A/B testing and paywalls
Key elements of paywalls
Reducing trial anxiety: Promote trial reminders heavily to alleviate concerns.
Pre-select the annual plan: Show multiple options (‘See all plans’), but only offer a trial on the annual plan.
Monthly pricing framework: Present the annual plan as a monthly breakdown, making the best value choice with an incentive.
Use a decoy plan: Add a less attractive option to make the annual plan seem like the obvious choice.
Offer a discount after installation: For example, on a secondary paywall during onboarding or after a trial cancellation.
By following these strategies, you can maximise your mobile app's revenue and turn downloads into sustainable income. It's up to you!